Introduction
Picture this: it's Wednesday morning. The ownership team wants a project health update. Your WIP report is 14 days old, built from a CSV export that took three evenings to format, and the numbers still don't reconcile with what the project manager sees in Procore. You spend the first 20 minutes of the meeting explaining why the data is stale instead of discussing what to do about it.
This is the "Wednesday meeting" problem — and nearly every construction finance team knows it.
Construction operates on razor-thin margins. According to CFMA's 2025 Construction Financial Benchmarker, the average net income before tax margin across 1,558 construction companies sits at just 6.7%. At that margin, a cost overrun that goes undetected for three weeks can wipe out the profit on an entire job.
That lag is the core problem. A real-time financial dashboard replaces the manual export-reformat-reconcile cycle with an automatically refreshed view pulled directly from your ERP — so when a cost overrun starts forming, you see it in time to act, not in time to explain it.
Key Takeaways
- WIP reporting cycles that take 10–20 days manually refresh overnight (or faster) with a direct ERP integration
- WIP schedules, job cost variance, AR aging, and retainage require dashboards built for construction — not generic BI tools
- Direct ERP integration is non-negotiable — manual data entry reintroduces the same errors dashboards are designed to eliminate
- Daily financial visibility moves the CFM role from data gatherer to strategic advisor
- Construction-specific dashboard platforms can have live ERP data flowing in 2–4 weeks
The Financial Blind Spots Costing Construction Firms
The Manual Reporting Trap
The traditional construction finance workflow goes something like this: data lives in the ERP, but getting it out requires a CSV export, an Excel reformatting session, reconciliation across cost codes, and a cross-reference against whatever the project manager pulled from Procore. Each step introduces lag and error — not because the ERP is wrong, but because the distance between accurate data and the people who need it is too great.
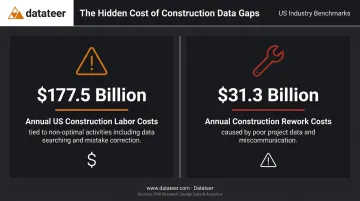
Research from PlanGrid and FMI found that $177.5 billion in annual US construction labor costs are tied to non-optimal activities — including fixing mistakes and searching for project data. The same research attributed $31.3 billion in annual rework costs to poor project data and miscommunication.
The Field-to-Office Gap
The data fragmentation problem is structural. Field crews log time and costs in one system. Project managers track progress in another. Finance works from a third. Without a unified view, each team operates on a different version of the financial truth.
Finance questions the project manager's numbers. The project manager disputes the cost codes in the ERP. Meanwhile, nobody is looking at whether the job is heading toward a loss. When Procore doesn't communicate with the finance system, teams spend more time arguing about data accuracy than fixing actual project problems.
What Real-Time Dashboards Solve
A real-time financial dashboard eliminates the manual extraction step entirely. Data pulls directly from the ERP on an automated schedule, gets cleaned and standardized at the integration layer, and populates dashboard views that finance teams, project managers, and executives can all access simultaneously.
The practical impact across teams:
- Finance stops chasing exports and starts analyzing trends
- Project managers see current job costs without waiting on the controller
- Executives get a consistent view of cash position and job margin every morning
- Disputes over whose numbers are "right" disappear — there's only one set
The Financial KPIs That Belong on a Construction Dashboard
Construction finance is fundamentally different from finance in other industries. Percentage-of-completion accounting, WIP schedules, retainage holdbacks, and job-level cost tracking don't exist in SaaS or retail. Generic BI dashboards borrowed from other sectors miss most of what matters.
Here are the four KPI categories that belong on every construction financial dashboard.
WIP Schedule and Percentage of Completion
The WIP schedule is the single most important financial report in construction. It tracks over/underbillings, estimated costs to complete, and recognized revenue on every active job. Without it, there's no reliable picture of project-level profitability.
Producing this report manually takes 10–20 days after period close. By the time leadership sees it, the data reflects decisions made weeks ago — catching margin fade on a 20-day-old WIP schedule is often too late to matter.
Automated WIP dashboards — like those in Datateer's platform — calculate percentage complete, earned revenue, billed revenue, over/underbillings, and projected margin per job by pulling directly from the ERP. Double L Management, a Datateer customer, put it plainly: "That one click replaced two weeks' worth of prior work."
Job Cost Report and Budget vs. Actual
The job cost report is the ground-level financial view. It compares estimated costs to actual costs at the cost-code level, breaking down variance by:
- Labor: hours and rates versus budget
- Materials: actual spend versus estimated quantities
- Subcontractors: committed costs, invoiced amounts, and variance
- Equipment and overhead: actual versus allocated
The difference between catching a labor overrun in week three versus week eight is the difference between a manageable correction and a write-off. A live budget-vs.-actual view gives project managers the information to act mid-job — not at closeout.
Cash Flow, AR Aging, and Retainage
Cash flow is a survival metric in construction. Levelset's 2022 Construction Cash Flow and Payment Report found that only about 1 in 10 construction businesses are always paid on time, with average Days Sales Outstanding around 90 days. Slow payments contributed to reduced profit for 41% of construction businesses and failure to meet payroll for 18%.
Add retainage — typically 5–10% of each payment withheld until project completion — and the cash complexity compounds. A real-time dashboard showing:
- AR aging by customer and project
- Outstanding retainage (both receivable and payable)
- 13-week cash flow forecast based on project burn rates
- Projected bank balance six months out
...gives CFOs and controllers the visibility to anticipate cash crunches before they become crises.
Backlog and Revenue Forecast
Backlog reporting is the forward-looking layer that transforms financial reporting from a historical record into a planning tool. A live backlog dashboard surfaces:
- Remaining contract value by project
- Projected burn rate and revenue trajectory for the next 90–180 days
- Forward visibility to drive staffing, equipment, and business development decisions
Without this view, firms routinely swing between over-capacity and underutilization, eroding margins in either direction.
How Real-Time Financial Dashboards Work: From ERP to Executive View
The Data Flow Architecture
A construction financial dashboard starts with the ERP connection. Data is extracted from the firm's system — whether that's Sage 300, Vista by Viewpoint, Foundation, Acumatica, Procore, or another platform — on an automated schedule. Datateer's standard cadence is overnight, with more frequent refresh available for clients who need it.
At the integration layer, raw ERP data gets cleaned and standardized: cost codes are mapped, naming conventions normalized, and the firm's chart-of-accounts logic translated into a consistent structure.
This step is where most homegrown dashboard projects break down. Inconsistent cost codes and mismatched account mappings surface as bad data in the dashboard view, and that kills adoption fast.
Datateer handles this standardization automatically, reconciling data across systems — for example, Procore project commits against Sage invoices — so no one is manually patching mismatches. The result is 100% ERP-sourced data integrity, not a cleaned-up approximation built on a spreadsheet.
Role-Specific Dashboard Views
One source of truth doesn't mean one dashboard for everyone. Datateer organizes its 12 dashboards across four suites aligned to different roles:
| Role | Suite | Key Views |
|---|---|---|
| Executive / Owner | Strategic Health | Return on assets/equity, forecasted liquidity, cash conversion |
| CFM / Controller | Cash Operations | AR & AP health, WIP & financial truth, job-level cash flow |
| Project Manager | Field Performance | Project cost performance, budget vs. actuals, PM scorecards |
| Operations | Resource Productivity | Labor & materials, subcontractor performance, equipment utilization |
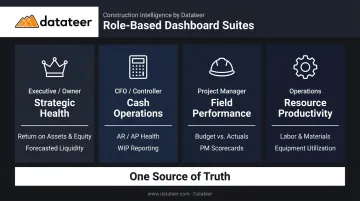
Each role sees the relevant slice of the same underlying data — which eliminates the version-conflict problem entirely.
What "Real-Time" Actually Means Here
That role-based structure only delivers value if the data behind it is current. "Real-time" in a construction finance context doesn't mean second-by-second streaming — it means eliminating the multi-day lag that prevents timely decisions. The goal is straightforward: a CFM arrives Monday morning with data from Friday, not data from three weeks ago.
Overnight automated sync accomplishes that. The 10-to-20-day manual close cycle is gone. What remains is a consistent, automated cadence that keeps every dashboard current without anyone touching a spreadsheet.
The Business Impact: From Forensic Accounting to Strategic Finance
The CFM Role Transformation
Before real-time dashboards, the construction CFM spends the majority of each month gathering, cleaning, and formatting data. It's forensic work: reconstructing what happened rather than influencing what happens next.
Datateer's customers describe CFMs spending evenings copying data from ERP systems into Excel, with month-end close consuming weeks of effort for a report that's already outdated when it's distributed.
After implementation, that time gets redirected. The data work is automated. What remains is analysis: explaining variances, flagging risks, advising ownership on which projects are healthy and which need attention. The CFM moves from the back office to the conversation.
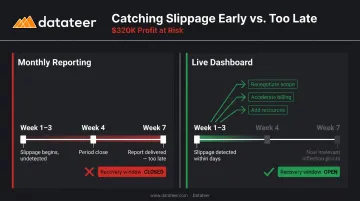
Margin Protection: The Direct Financial ROI
Consider a general contractor running a $4M commercial project at a projected 8% margin — roughly $320,000 in expected profit. Labor slippage begins in week three, driven by a subcontractor working slower than estimated.
In a monthly reporting environment, that slippage appears at the end of the month, reported three weeks after period close. By the time it's visible, the job may be six or seven weeks in, with limited options for recovery.
With a live job cost dashboard, the same slippage surfaces within days. Recovery options are still on the table:
- Renegotiate scope with the subcontractor
- Accelerate billing to improve cash position
- Bring in additional resources before the schedule compounds
Without that visibility, the variance quietly becomes a write-off.
Bonding and Banking Relationships
Surety underwriters and lenders require current WIP schedules and financial statements as part of their underwriting process. According to UFG Insurance Surety, timely financial reporting is directly connected to a contractor's ability to maintain bonding capacity.
A firm that can produce a fresh, auditable WIP report on demand — rather than presenting 30-day-old data — demonstrates financial control. That matters in bond renewal conversations and credit line negotiations. Few contractors walk into those conversations with current numbers. The ones who do negotiate from a stronger position.
The Weekly Financial Rhythm
Real-time dashboards enable a fundamentally different operating cadence. Instead of a monthly close grind followed by a stale report, teams can run a weekly financial review on live numbers. Project managers see their own job cost data and take ownership of variances. Finance shifts from delivering last month's bad news to flagging this week's risks while there's still time to act.
When project managers own their numbers and finance reviews live data together, variance conversations happen earlier — and recovery rates follow.
How to Implement a Real-Time Construction Financial Dashboard
Build vs. Buy
Custom BI dashboards (Power BI, Tableau, or similar) require ongoing data engineering to build and maintain connectors, data models, and report logic. For construction, that means someone has to understand both BI tooling and construction accounting. Most custom builds take 12–18 months, cost significantly more than expected, and deliver partial functionality.
Purpose-built platforms like Datateer take a different path:
- Construction-specific data models, WIP logic, and cost code structures come pre-configured
- All 12 dashboards are available on day one — no build phase
- Setup takes 2–4 weeks, with annual fees starting only after data is flowing
A two-person finance team averaging 40 hours per month at $46/hour runs over $43,000 annually in manual reporting cost. A $10,000/year platform investment is not an expense — it's a return.
The Dirty Data Problem
The most common implementation pitfall is inconsistent data in the ERP. If cost codes are applied differently across project managers, or if job setup workflows vary, the dashboard surfaces that inconsistency rather than hiding it. This is actually useful — it makes data quality problems visible — but it needs to be addressed.
Successful implementations pair the technical setup with a data governance conversation:
- How are jobs set up in the ERP? Who does it?
- Are cost codes applied consistently across the field?
- Do subcontract entries follow a standard naming convention?
Datateer's automated cleaning handles much of this standardization, but the firm needs to own the governance rules for new job entry.
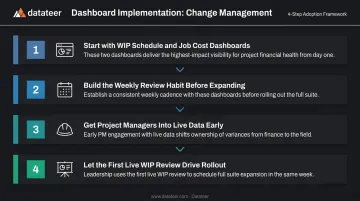
Change Management: The Slower Part
The technology setup is typically the faster half of an implementation. Shifting a team from a monthly close mindset to a live data mindset takes longer. A few practical recommendations:
- Start with two dashboards — WIP schedule and job cost are the highest-impact starting points
- Build the weekly review habit first — before expanding to the full dashboard suite
- Get project managers into the data early — when PMs see their own job cost performance in real time, ownership of variances shifts naturally
- Let the first live WIP review do the work — most leadership teams schedule the broader rollout within the same week after seeing real-time job cost data for the first time
Frequently Asked Questions
What financial KPIs should a construction dashboard track first?
Start with WIP schedule, job cost/budget variance, and AR aging. These three address the most common causes of margin erosion and cash risk. Once the team is reviewing these weekly, backlog, retainage, and cash flow forecasting add significant additional value.
How is a real-time financial dashboard different from the reports already in my ERP?
ERP reports are static, require manual generation, and show data for one job at a time. A dashboard aggregates data automatically across all active projects and presents multi-job views covering portfolio margin, cross-project AR aging, and total cash position — none of which any standard ERP report module provides.
What is a WIP schedule and why does it need to be on a dashboard?
The WIP schedule tracks over/underbillings, estimated cost to complete, and recognized revenue across all active projects. Producing it manually takes 10–20 days after period close, by which point it's too late for proactive decisions. Automated WIP visibility turns it into a daily management tool instead of a monthly compliance report.
How long does it take to set up a construction financial dashboard?
With a purpose-built platform and direct ERP connectors — including Sage, Vista, Acumatica, Foundation, CMiC, and Procore — data can be flowing in 2–4 weeks. Custom BI builds on generic platforms typically take months and require ongoing engineering support.
Can a financial dashboard integrate with my existing construction ERP?
Yes. Datateer integrates directly with 12+ construction ERPs through native connectors — not CSV exports — which is what makes the data reliable and low-maintenance. Custom integrations are available for legacy or less common systems.
How do real-time financial dashboards help prevent margin fade?
Margin fade happens gradually at the cost-code level and is invisible in monthly reports until significant damage is done. A live job cost dashboard surfaces labor and material overruns within days of occurrence — while there's still time to renegotiate scope, accelerate billing, or adjust resources before the variance becomes a write-off.