That's what ROA answers. For every dollar of assets tied up in this business, how much profit is coming back out?
This article covers the ROA formula in a construction context, what actually counts as an asset on a contractor's balance sheet, real benchmarks from CFMA's 2025 Construction Financial Benchmarker, and the most common mistakes firms make when interpreting this number.
Key Takeaways
- ROA = Net Income ÷ Total Assets × 100 — measures how efficiently a construction firm converts its asset base into profit
- Construction ROA benchmarks are higher than many expect: 10–15% for top segments per CFMA 2025 data
- Receivables, underbillings, and idle equipment all inflate total assets and suppress ROA
- A low ROA typically signals idle equipment, slow collections, or capital tied up in underbillings
- Improving ROA requires attacking both sides: increasing net income and tightening the asset base
What ROA Means in Construction
ROA is a profitability efficiency ratio: Net Income ÷ Total Assets × 100. A 10% ROA means the company generates $0.10 in profit for every $1 of assets deployed.
That definition is simple. Applying it to construction is not.
Why It Matters More Here Than in Other Industries
A consulting firm's assets are mostly people and laptops. A contractor's assets are excavators, concrete forms, receivables from a slow-paying GC, and $400,000 in materials sitting in a yard. Every idle day those assets exist without generating income drags ROA down.
This is why ROA cuts through revenue noise in a way gross margin can't. A construction company can grow revenue 20% year-over-year while its ROA declines — which happens when the asset base expands faster than profitability. That's a classic warning sign of a company that's winning work but not winning efficiently.
The DuPont Decomposition for Construction CFOs
ROA has two components:
ROA = Net Profit Margin × Asset Turnover
- Net profit margin = Net Income ÷ Revenue (how much you keep per dollar billed)
- Asset turnover = Revenue ÷ Total Assets (how much revenue each dollar of assets generates)
This decomposition — part of the DuPont analysis framework — tells a CFO where the ROA problem lives. A low-margin firm needs better job selection or cost control. A low-turnover firm has too many assets sitting idle relative to its revenue base.
Often it's both — which is why looking at ROA alone without decomposing it leads to the wrong diagnosis and the wrong fix.
ROA is a company-level metric, not a project-level one. It aggregates all net income and all assets across the balance sheet. Project profitability (gross margin, job cost variance) is a related but separate measure — conflating them leads to flawed capital allocation decisions.
Breaking Down the Construction Asset Base
The denominator in the ROA formula is where most contractors get tripped up. Total assets includes far more than equipment.
What's Actually in the Denominator
A typical construction balance sheet includes:
- Cash and equivalents — operating liquidity
- Accounts receivable — amounts billed but not yet collected
- Underbillings (costs in excess of billings) — work performed but not yet invoiced
- Retainage receivable — earned but contractually withheld amounts
- Materials and inventory on hand — pre-purchased supplies sitting in the yard
- Equipment and fleet — heavy iron, vehicles, tools, both owned and financed
- Right-of-use assets — operating and finance leases now recorded on-balance-sheet under ASC 842
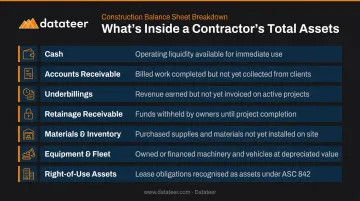
Every item on that list inflates the denominator — and anything sitting unproductively compresses ROA.
The Underbilling Problem
Underbillings are a quiet ROA killer. When a contractor performs work but hasn't invoiced for it yet, that balance sits on the balance sheet as a current asset — growing total assets without a corresponding increase in net income. A firm with $3M in underbillings is essentially carrying $3M in assets that are generating zero current return.
CFMA's 2025 benchmarking data shows the industry has improved here — underbillings-to-equity dropped from 10.3% in 2015 to 8.1% in 2024 — but it remains a meaningful drag for firms that don't monitor their WIP positions closely.
Use Average Assets, Not Ending Assets
One calculation nuance that matters: use average total assets (beginning-of-period + end-of-period ÷ 2) rather than the ending balance.
Consider a contractor who starts the year with $8M in total assets and purchases $2M of equipment mid-year. Year-end balance: $10M. Using that figure understates efficiency — $2M of that equipment only worked for half the year.
Averaging to $9M gives a more accurate picture of capital deployment across the full period.
What Is a Good ROA for a Construction Company?
The short answer: higher than most people assume, and always benchmark within your segment.
CFMA 2025 Benchmarks by Segment
Based on fiscal 2024 data from CFMA's 2025 Construction Financial Benchmarker — covering 1,558 construction companies:
| Segment | ROA | Net Income Margin | Debt-to-Equity |
|---|---|---|---|
| Industrial & Nonresidential | 10.4% | 4.4% | 2.7 |
| Heavy Construction | 13.2% | 8.3% | 0.8 |
| Specialty Trades | 14.6% | 7.7% | 1.0 |
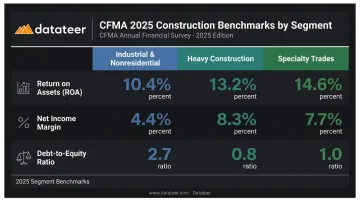
These numbers are higher than the "3%–8%" range often cited in generic financial literature — a reminder that construction benchmarks vary significantly by data source, year, and sample composition.
Why Specialty Trades Outperform GCs on ROA
Specialty subcontractors (electrical, plumbing, HVAC) tend to post higher ROA than general contractors for a structural reason: smaller asset bases. Faster billing cycles and leaner balance sheets keep total assets low, which directly boosts ROA.
GCs, by contrast, carry larger receivables and WIP balances (partly because they're managing flows between owners and subs), which inflates total assets and suppresses ROA relative to specialty trades.
The critical rule: never benchmark a mechanical contractor's ROA against a real estate firm, a bank, or a software company. Capital intensity differences make cross-industry comparisons misleading. As Investopedia notes, ROA should only be compared among firms in the same sector. Always compare against the same trade, similar revenue size, similar business model.
What Factors Drive ROA Down in Construction
Idle and Underutilized Equipment
Owned equipment that sits between projects generates depreciation, insurance, and financing costs without contributing a dollar to revenue. This kills asset turnover — and by extension, ROA.
The own-versus-rent decision is directly an ROA decision. Every underutilized owned asset increases total assets without a proportional lift in net income. The practical implications:
- Contractors who own aggressively need rigorous utilization tracking to justify the asset base
- Those who rent strategically carry fewer assets on the balance sheet, mechanically supporting higher ROA
- Fleet decisions made purely on monthly cost miss the ROA consequence entirely
Margin Fade on the Wrong Job Mix
Taking on low-margin or high-complexity projects pulls net income down while the asset base stays constant. FMI research illustrates this starkly: one $10M project faded from a 9.3% original estimated margin to 4.2% final margin — more than half the expected profit evaporated through the life of the job.
A shift toward higher-margin work — without proportionally growing the asset base — is one of the fastest ROA levers available to a contractor. Job selection is capital allocation.
Receivables Lag and Underbilling Accumulation
Margin compression hits the income side of the ROA equation. Slow collections hit the other side — they inflate the asset base without adding a cent to earnings. Consider a firm with $20M in annual revenue and a DSO that drifts from 45 to 75 days. That 30-day slip adds roughly $1.6M to the receivables line on the balance sheet — increasing total assets without adding a cent to net income, and compressing ROA accordingly.
D&B data shows the severity of this problem varies across construction categories: 31.3% of accounts receivable dollars for general contractors (SIC 15) were 91+ days past due, compared to just 1.1% for specialty trades. That delinquency gap is a measurable ROA difference between two firms with identical revenue — one collecting on time, one not.
How Construction Finance Leaders Track and Improve ROA
The Stale Data Problem
ROA requires clean, current data on both net income and total assets. Most construction firms don't have it. Balance sheets are often days or weeks stale by the time they reach the CFO — which means ROA becomes a backward-looking report card rather than a tool for proactive decisions.
The levers that move ROA (underbillings, receivables, equipment positions) change continuously through the project cycle. A monthly financial package doesn't give a finance leader enough resolution to act before the damage is done.
The Operational Levers
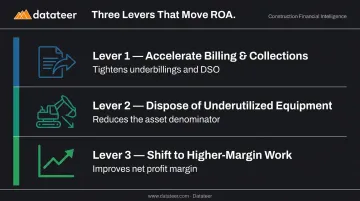
Three moves have the most direct impact on ROA:
- Accelerate billing and collections — tightens underbillings and DSO to tighten the asset base and improves ROA without touching margins
- Dispose of aging, underutilized equipment — selling assets that no longer generate adequate returns directly reduces the denominator
- Shift project mix toward higher-margin work — improving net profit margin improves ROA even with the same asset base
The DuPont decomposition covered earlier identifies which lever to pull first. If asset turnover is lagging, the fix lives on the balance sheet. If net profit margin is the problem, the focus shifts to job selection and cost control.
Real-Time Visibility as a Prerequisite
Datateer addresses the staleness problem by syncing directly with construction ERPs — Procore, Sage 100/300/Intacct, Viewpoint Vista, Acumatica Construction, Foundation Software, and others — eliminating manual exports and the lag that makes ROA data unreliable.
The Executive Strategy & Solvency suite includes a dedicated Return on Assets/Equity/Revenue dashboard so CFOs see current ratios, not last month's. The components feeding into ROA are tracked across three dashboards:
- WIP & Financial Truth dashboard — surfaces costs-in-excess-of-billings per job, showing exactly how underbilled work inflates total assets
- AR & AP Health dashboard — tracks receivables aging and DSO with live balances, not estimates
- Equipment Utilization dashboard — flags which assets are generating returns and which are sitting idle
Finance teams that operate this way stop treating ROA as a quarterly report card. They track it continuously — and intervene while the project is still in motion.
Common ROA Misinterpretations in Construction
Three patterns trip up even experienced construction finance teams when reading ROA numbers.
Don't benchmark against tech companies. A construction firm at 10–12% ROA is performing well by industry standards. Comparing that number to a software company's 25%+ ROA tells you nothing — the asset bases are incomparable by design. Benchmark within the same trade and revenue tier.
ROA measures the company, not the job. Project profitability lives in gross margin, job cost variance, and cost-to-complete — all important, but separate from ROA. Conflating them leads to decisions like keeping a low-ROA piece of equipment because "it worked on the last project."
Don't ignore the denominator. Many contractors try to improve ROA purely by pushing net income higher: better margins, more revenue. That's half the equation. Collecting receivables faster, billing promptly to reduce underbillings, and disposing of surplus equipment can move ROA just as meaningfully — and the balance sheet changes are often quicker to execute than margin improvements.
Frequently Asked Questions
What is ROA in construction?
ROA (Return on Assets) measures how efficiently a construction company converts its total asset base — equipment, fleet, receivables, WIP, and inventory — into net profit, calculated as Net Income ÷ Total Assets × 100. A higher ROA indicates the company is generating more profit per dollar of assets deployed.
What is ROA in project management?
In project management, ROA is sometimes used informally to evaluate whether assets allocated to a specific project are generating adequate returns. ROA is a company-level financial ratio — project-level analysis uses gross margin or job cost variance instead.
What is a good ROA for a construction company?
Per CFMA's 2025 benchmarking data (fiscal 2024), construction ROA ranges from 10.4% for Industrial/Nonresidential contractors to 14.6% for Specialty Trades. These benchmarks are specific to construction — always compare within the same trade and firm size.
How does WIP affect ROA in construction?
Large underbilling balances (costs in excess of billings) sit on the balance sheet as current assets, inflating the denominator in the ROA formula without adding to net income. Prompt billing and tight WIP management are directly tied to maintaining a healthy ROA.
What is the difference between ROA and ROE for contractors?
ROA measures returns against all assets (funded by both debt and equity), while ROE measures returns against owner equity only. For a heavily leveraged contractor, ROE will appear much higher than ROA; CFMA data shows Industrial/Nonresidential firms at 10.4% ROA but 37.4% ROE.
How can a construction company improve its ROA?
Three primary levers:
- Improve net profit margin through better job selection and cost control
- Reduce the asset base by selling idle equipment and accelerating collections
- Bill more promptly to shrink underbilling balances that inflate total assets without contributing to income