Introduction
Procore generates enormous volumes of project and financial data, but most construction finance teams are still exporting it into Excel to manually build WIP reports, job cost summaries, and executive dashboards. That process routinely consumes 10–20 days per month, leaving CFOs and controllers working from data that's already weeks stale.
A growing category of construction data analytics tools now bridges Procore's project data with automated financial reporting. Instead of the monthly export-format-review cycle, these platforms deliver live dashboards built specifically for construction finance, tracking WIP, job cost, margin fade, and cash flow in real time.
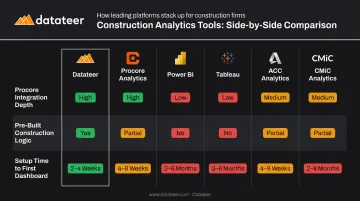
This guide evaluates six leading tools: Datateer, Procore Analytics, Microsoft Power BI, Tableau, Autodesk Construction Cloud Analytics, and CMiC Analytics. For each, you'll find a clear breakdown of Procore integration depth, financial reporting capability, implementation complexity, and pricing — so you can identify which platform fits your firm's size and workflow.
Key Takeaways
- Construction firms on Procore still rely on Excel for financial reporting, creating data lag and manual errors that drive costly reporting errors
- Dedicated analytics tools connect Procore data directly to live dashboards, cutting close prep from days to minutes
- Top tools include Datateer, Procore Analytics, Power BI, Tableau, ACC Analytics, and CMiC Analytics
- Key selection criteria: Procore integration depth, pre-built construction financial logic, setup time, and total cost of ownershipKey selection criteria: Procore integration depth, pre-built construction financial logic, setup time, and total cost of ownership
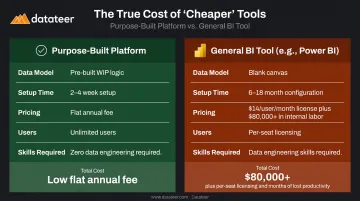
- Purpose-built platforms go live in weeks; general BI tools require months of internal configuration before delivering value
Why Construction Firms Need Analytics Beyond Procore and Excel
Procore handles project management workflows well. Its native reporting, though, wasn't designed for the financial analysis construction CFOs need — WIP schedules, margin forecasting, budget-to-actual by cost code, and cash flow at the job level.
Most finance teams work around this gap the same way: export raw data to Excel, massage it into reports, and distribute them two to four weeks after the underlying project activity occurred. By then, margin fade has already set in on underperforming projects.
That delay has a cost beyond efficiency — the finance team spends weeks each month formatting rather than advising.
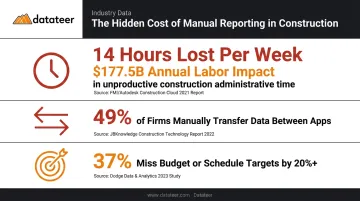
The cost of this pattern shows up across the industry:
- FMI research found that construction project team members lose more than 14 hours per week on non-optimal activities, with an estimated $177.5 billion annual labor-cost impact in U.S. construction
- 49% of firms manually transfer data between applications, and 30% use applications that don't integrate with one another
- KPMG's 2023 Global Construction Survey found that 37% of respondents missed budget or schedule targets by 20% or more — up from 32% in 2021
Excel-dependent reporting creates more than an efficiency problem. Stale data drives decisions, change orders go untracked, and labor slippage stays invisible until monthly close — by which point the damage is already done. The tools covered below exist specifically to close that gap.
Top Construction Data Analytics Tools for Procore & Excel
The tools below were evaluated for Procore integration depth, ability to reduce or eliminate manual Excel reporting, and capacity to deliver construction-specific financial insights (WIP, job cost, margin tracking, and cash flow) that finance teams actually use day-to-day.
Datateer
Datateer is a purpose-built Financial Operating System for construction, connecting Procore and 20+ other construction ERPs directly to automated executive dashboards. It replaces the manual export-format-reconcile pipeline that most CFMs manage through Excel.
What makes it different from general BI tools: the platform ships with 12 construction-specific dashboards on day one (WIP and over/under-billings, job-level cash flow, budget vs. actuals, margin protection, change order aging, and PM scorecards) organized across four strategic suites. No blank canvas to configure. No data engineering required. A client at Double L Management described the experience: "That one click replaced two weeks worth of prior work."
Datateer starts at $10,000 per year per data source with unlimited users, and data typically flows within 2–4 weeks.
| Category | Details |
|---|---|
| Key Features | WIP & over/under-billings, job-level cash flow, budget vs. actuals, margin fade alerts, change order tracking, PM scorecards, retainage analytics, ASC 606 revenue recognition, 13-week cash flow forecasting; 12 dashboards on day one, scaling to 50+ |
| Procore & Excel Integration | Direct ERP sync with Procore and 20+ construction ERPs; automated data extraction and cleaning eliminates Excel exports; CSV uploads supported for manual data |
| Pricing | Flat annual fee starting at $10,000/year per data source; unlimited users; setup fee paid upfront, annual fees begin when data is flowing |
Procore Analytics (Native)
Procore Analytics is the built-in business intelligence layer within Procore, letting teams already on the platform build custom dashboards and visualize project, cost, and safety data without a separate tool.
Its strongest advantage is native data access : no export or connector required. Procore Analytics 2.0 uses Databricks technology with hourly data refreshes and includes a business semantic model. The platform's Cloud Connector can share data directly to Power BI and Tableau for teams that need deeper financial analysis.
The limitation: advanced financial outputs like WIP schedules and margin forecasting typically require pairing with Power BI or a dedicated financial analytics tool. Procore Analytics 1.0 is also scheduled for deprecation on June 30, 2026, so teams on the older version need to migrate.
| Category | Details |
|---|---|
| Key Features | Custom dashboards, prebuilt project and financial report templates, company-wide performance benchmarking, hourly data refresh via Analytics 2.0 |
| Procore & Excel Integration | Native Procore integration; Cloud Connector supports data sharing to Power BI, Tableau, and data warehouses; Excel export available |
| Pricing | Custom pricing; Procore does not publish flat product prices — contact Procore for a quote |
Microsoft Power BI
Power BI is Microsoft's business intelligence platform, connecting to Procore via the Analytics Cloud Connector and ingesting Excel files natively. It's a natural fit for construction firms already running Microsoft 365.
Finance teams familiar with Excel find Power BI's interface approachable, and the Delta Sharing connector lets Power BI Desktop pull Procore data directly.
The tradeoff is setup time. Building construction-specific financial models (WIP logic, cost code hierarchies, job cost roll-ups) requires internal data engineering expertise and significant configuration effort before the first useful dashboard appears.
Power BI Pro is priced at $14.00 per user/month (billed annually); Power BI Premium Per User is $24.00 per user/month. Sharing and collaboration require paid licensing in most cases.
| Category | Details |
|---|---|
| Key Features | Custom drag-and-drop dashboards, DAX formula support, scheduled data refresh, Excel data import, construction report templates available via marketplace |
| Procore & Excel Integration | Connects to Procore via Procore's Analytics Cloud Connector using Delta Sharing; native Excel data source connection; integrates with Microsoft 365 |
| Pricing | Power BI Pro: $14/user/month; Power BI Premium Per User: $24/user/month (billed annually); free tier limited to personal use |
Tableau
Tableau is a data visualization platform built for large, multi-project datasets with deep visual output capabilities. Construction teams connect it to Procore through Procore's Analytics 2.0 Cloud Connector or third-party connectors like CData, and can use Excel files as a direct data source.
The strengths are visualization depth and cross-source data blending. That said, Tableau has no native construction financial logic. WIP accounting, cost code structures, and margin forecasting must be built from scratch, and per-user pricing makes that configuration investment more significant at scale.
Standard pricing: Viewer at $15/user/month, Explorer at $42/user/month, Creator at $75/user/month (billed annually). Enterprise tier pricing is higher.
| Category | Details |
|---|---|
| Key Features | Advanced data visualization, Tableau Prep for data cleaning, cross-source data blending, mobile-accessible dashboards, published workbooks for team sharing |
| Procore & Excel Integration | Connects to Procore via Analytics 2.0 Cloud Connector or CData third-party connector; Excel files supported as direct data source; no native certified Procore connector built in |
| Pricing | Standard: Viewer $15, Explorer $42, Creator $75/user/month; Enterprise: Viewer $35, Explorer $70, Creator $115/user/month (billed annually) |
Autodesk Construction Cloud Analytics
Autodesk Construction Cloud (ACC) (now part of Autodesk Forma) includes an analytics module designed for BIM-forward firms. Its Construction IQ feature uses machine learning to surface safety and quality risks, and its Data Connector lets teams extract project data directly to Power BI.
ACC Analytics makes the most sense for firms already running the Autodesk ecosystem (Revit, BIM 360, Forma Build). For pure financial analytics (WIP reporting, margin tracking, job costing) the setup complexity relative to value is a real consideration for firms not already invested in Autodesk's stack. There is no native ACC Analytics integration with Procore.
| Category | Details |
|---|---|
| Key Features | AI-powered risk scoring (Construction IQ), cost and budget dashboards, quality and safety trend analysis, cross-project benchmarking, Data Connector for Power BI |
| Procore & Excel Integration | Designed for Autodesk ecosystem; no native Procore integration for analytics; Excel export available; third-party connectors exist |
| Pricing | Requires ACC/Forma subscription; analytics and Data Connector access tied to plan tier — contact Autodesk for pricing |
CMiC Analytics
CMiC is a construction ERP with an embedded analytics layer for unified financial and operational reporting. Analytics are accessed directly from the CMiC Enterprise Console, and because the data is native to the ERP, financial data (payroll, accounts payable, job costs) feeds dashboards in real time without a separate integration.
CMiC also offers a Procore integration that maps shared data objects (jobs, vendors, costs, subcontracts, change orders) across both platforms to reduce redundant entry. That said, CMiC Analytics is not available as a standalone product : it requires a CMiC ERP implementation, and pricing is enterprise contract-based.
| Category | Details |
|---|---|
| Key Features | Prebuilt dashboards for cost, labor, and productivity; role-specific reporting templates; real-time ERP data refresh; embedded BI tools |
| Procore & Excel Integration | CMiC-native; Procore integration maps jobs, costs, subcontracts, and change orders; Excel export supported |
| Pricing | Enterprise contract pricing; no public pricing — contact CMiC directly |
How to Choose the Right Construction Analytics Tool
Three criteria separate tools that deliver real value from those that create a different kind of work:
1. Integration depth without manual exports Does the tool connect directly to Procore (and your ERP) on a scheduled basis, or does someone still need to export data and upload it? Any workflow requiring a human to move data between systems reintroduces the lag you're trying to eliminate.
2. Pre-built construction financial logic WIP accounting, percentage-of-completion, cost code hierarchies, and job-level cash flow aren't generic BI concepts — they require construction-specific data models. Tools like Datateer include this logic pre-built. Power BI and Tableau ship as blank canvases; the construction logic has to be built internally, which takes months and requires data engineering expertise most construction finance teams don't have on staff.
3. Total cost of ownership The published licensing fee is rarely the full cost. A $14/user/month Power BI license across 20 users is $3,360/year — but six months of internal configuration time can cost $80,000+ in loaded labor. At that point, the math changes completely.
McKinsey notes that reporting delays in large construction projects can take days or weeks to surface. Every week of delayed implementation extends that exposure.
These three criteria point to a common failure mode worth naming directly. Many firms choose Power BI or Tableau expecting plug-and-play construction analytics, then discover they've bought a blank canvas, not a solution.
The common mistake: General BI tools require building the entire construction layer from scratch before a single useful dashboard appears:
- Cost code mapping and hierarchy structures
- WIP accounting and over/under-billing logic
- Earned value and percentage-of-completion formulas
- Job-level cash flow models
That build typically takes six to eighteen months and requires data engineering skills most construction finance teams don't have in-house.
For construction firms between $10M and $1B+ in annual revenue, purpose-built platforms with pre-mapped construction data models and automated ERP-to-dashboard data flows typically deliver faster ROI than starting with a blank canvas.
Conclusion
Construction firms have more analytics options than ever. The right choice comes down to one question: do you need flexibility to build anything, or do you need construction financial intelligence working next week?
Power BI and Tableau offer genuine power and flexibility — for teams with the data engineering capacity to build construction-specific models and the time to do it. For most construction finance teams, that timeline isn't realistic.
For teams whose priority is eliminating the Excel grind and getting real-time WIP, margin, and cash flow visibility now, purpose-built platforms do that work in advance. Purpose-built means catching margin fade and labor slippage while there's still time to act — not reconstructing what went wrong after the job closes.
Datateer connects Procore and 20+ construction ERPs to a complete Financial Operating System. Here's what that looks like in practice:
- 12 dashboards live on day one, no build time required
- Flat annual pricing starting at $10,000/year per data source, unlimited users
- 2–4 week setup with data flowing before annual fees begin
To see how it maps to your current workflow, reach out at hello@datateer.com or book a free 15-Minute Workflow Audit — no slides, no pitch.
Frequently Asked Questions
What are the top construction data analytics tools that integrate with Procore and Excel?
The leading tools are Datateer, Procore Analytics, Microsoft Power BI, Tableau, Autodesk Construction Cloud Analytics, and CMiC Analytics. Purpose-built platforms like Datateer offer faster time-to-value with pre-built construction financial dashboards, while general BI tools like Power BI and Tableau require custom configuration before producing construction-specific outputs.
Does Tableau integrate with Procore and Excel?
Tableau connects to Procore through Procore's Analytics 2.0 Cloud Connector or third-party tools like CData, and supports Excel files as a direct data source. There is no native Procore connector in Tableau, so some configuration is required to pull live project and financial data.
What is the difference between Procore Analytics and a dedicated construction BI tool?
Procore Analytics visualizes data already inside Procore and integrates well with Power BI for extended analysis. Dedicated platforms like Datateer pull from multiple ERPs, automate data transformation, and deliver deeper financial analysis — WIP schedules, margin forecasting, job-level cash flow — across all projects without requiring custom data modeling.
Can construction analytics software replace Excel for WIP reporting?
Yes. Purpose-built tools like Datateer automate WIP reporting, replacing a manual export-format-review cycle that typically consumes 10–20 days per month with an overnight-refreshing dashboard. One Datateer client replaced two weeks of manual work with a single click.
How long does it take to implement a construction analytics tool?
General BI tools like Power BI can take months to configure for construction-specific WIP and job cost reporting. Purpose-built platforms with pre-built construction financial models, like Datateer, typically have data flowing within 2–4 weeks.
What financial KPIs should a construction analytics dashboard track?
The most critical construction finance KPIs are:
- WIP (overbilling/underbilling)
- Job cost vs. budget
- Gross margin by project
- Labor productivity and slippage
- Cash flow and liquidity
- Change order impact and aging
The best tools surface these automatically from ERP data rather than requiring manual calculation.