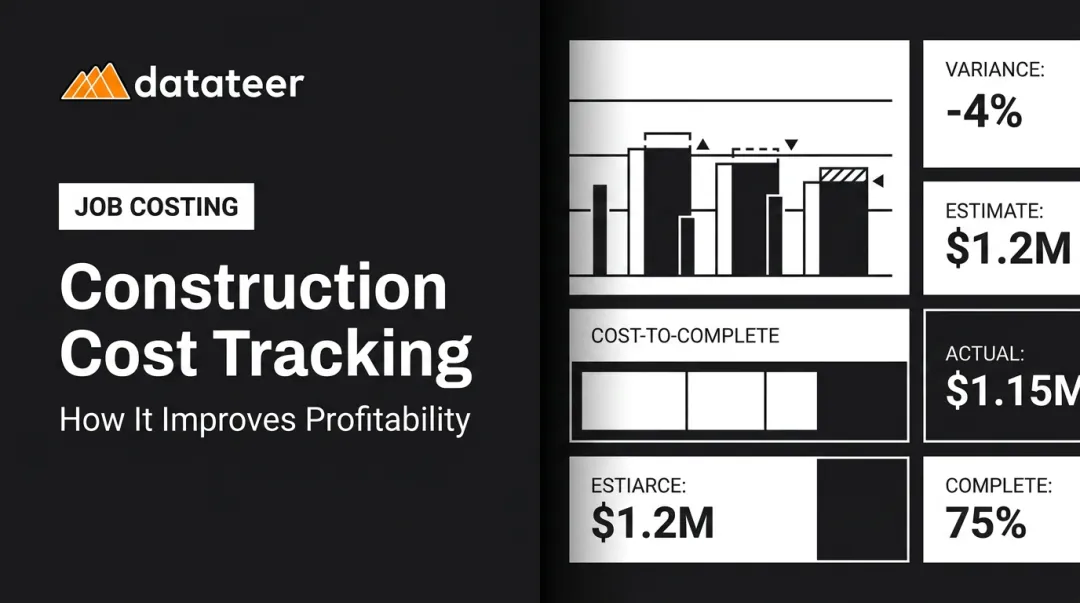
Introduction
Construction operates on margins that leave little room for error. According to CFMA's 2024 Construction Financial Benchmarker, the average net income before taxes across 1,290 construction companies was just 6.3% of revenue — and industrial and nonresidential contractors averaged only 4.1%. On margins that thin, a single project running over on labor or billing behind schedule doesn't just hurt that job. It can wipe out the profit from two other jobs.
The problem isn't a lack of data. Most construction companies generate plenty of it. The problem is timing. Monthly spreadsheet reports and WIP schedules that take two weeks to compile show leadership what went wrong — after it's already locked in. By that point, the project is past the stage where course correction is affordable.
The KPIs that actually move the needle share one trait: they surface problems while there's still time to act. This article covers which metrics matter most, why most firms aren't getting value from the ones they already track, and what changes when the data arrives in hours instead of weeks.
Key Takeaways
- Construction KPIs are high-priority measurements tied to business outcomes — not just reporting statistics
- The most impactful KPIs span four categories: financial, operational, safety, and quality
- KPMG's 2023 Global Construction Survey found that 37% of respondents missed budget or schedule targets by 20% or more
- KPIs only protect profitability when they're current — a WIP report that's two weeks old tells you what already happened, not what to do next
- Firms with real-time KPI visibility can catch margin fade, labor slippage, and cash shortfalls while they're still fixable
What Are Construction KPIs?
A KPI isn't just any number you track. It's a measurement specifically chosen because it connects directly to a business outcome — profit, delivery, safety, or growth. That distinction matters in construction, where project management systems and accounting platforms generate hundreds of data points. Most of those data points are ordinary metrics; only a small set earn KPI status.
Construction KPIs operate at two distinct levels:
- Project level — budget vs. actuals, schedule adherence, rework rate, cost variance by phase
- Business level — overall margins, backlog health, overhead cost ratio, cash position, bid-hit ratio
Both levels matter. A company can have strong project-level execution and still run into trouble at the business level if overhead is creeping up, backlog is thinning, or cash is tied up in retainage across a dozen jobs.
The defining characteristic of a real KPI is that it prompts a decision. If a number gets reported every month and nothing changes because of it, it's reporting for the sake of reporting — not a KPI.
Key Advantages of Tracking Construction KPIs
Real-Time Financial Visibility and Margin Protection
When financial KPIs — particularly WIP schedules, Cost Performance Index (CPI), and gross margin by project — are visible in real time, finance teams can catch margin erosion before a project closes at a loss.
Consider a practical example: labor running 12% over estimate at the 40% completion mark is recoverable if caught that week. The same variance discovered during post-close analysis is a permanent write-off. McKinsey has reported that 44% of construction projects end at a financial loss — a figure that reflects, in part, how many firms discover margin problems too late to address them.
For a firm running 10 concurrent projects, even modest margin slippage on half of them compounds into a material profit shortfall annually.
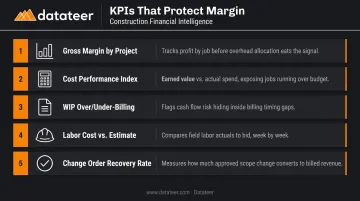
KPIs that protect margin:
- Gross margin by project (actual vs. estimated)
- Cost Performance Index (CPI = Earned Value / Actual Cost)
- WIP over/under-billing status
- Labor cost vs. estimate by cost code
- Change order recovery rate
For firms bidding thin margins or managing multiple projects at once, this visibility is the difference between catching a problem and writing it off.
Operational Efficiency and Labor Optimization
Labor is typically the largest controllable cost variable on a construction project. According to FMI's 2023 Labor Productivity Study, 60% of contractors reported that 11% or more of field labor costs are wasted — with total annual losses from poor productivity estimated at $30–40 billion across the industry.
The compounding nature of labor slippage is what makes early detection so valuable. A project running 5% over on labor hours at week two can easily be 20%+ over by week eight if nothing changes. At that stage, corrective options narrow considerably.
Operational KPIs give project managers the visibility to act when adjustments are still cheap:
- Schedule Performance Index (SPI = Earned Value / Planned Value)
- Labor productivity (work output per labor hour, or hours per unit installed)
- Percentage of labor downtime
- Equipment utilization rate
- Planned vs. actual completion dates
FMI also found that a 6% improvement in labor productivity would produce an average 50% increase in profitability for self-performing contractors — which is why operational KPIs function as margin protection tools, not just project management checkboxes.
Cash Flow Predictability and Liquidity Control
Even when projects run on schedule and labor costs are controlled, a firm can be genuinely profitable on paper and still face a cash crisis. Billing cycles, retainage withheld at 5–10% of contract value, and slow payment practices create a persistent gap between earned revenue and actual cash in hand.
Levelset's research found that the average construction industry Days Sales Outstanding was 83 days, and only 26% of contractors reported always being paid on time per contract terms. For firms carrying large retainage balances across multiple projects, the liquidity exposure is substantial.
Cash flow KPIs pull together bank balances, AR aging, billed-but-uncollected amounts, and projected future billings into a single picture of where cash stands today and where it will be in 30–60–90 days.
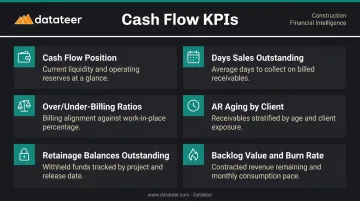
Key cash flow KPIs:
- Cash flow position (current and projected)
- Days Sales Outstanding (DSO)
- Over/under-billing ratios
- AR aging by client and project
- Retainage balances outstanding
- Backlog value and burn rate
Cash flow predictability lets firms take on new work confidently, extend reasonable payment terms, and avoid the expensive short-term borrowing that follows mid-project liquidity crunches. During rapid growth phases or periods when retainage balances are large relative to active cash, this visibility becomes a survival tool — not just a planning convenience.
The Most Important Construction KPIs to Track
Rather than monitoring dozens of metrics, construction firms should focus on 8–12 high-impact KPIs across four essential areas. CFMA recommends tracking no more than 8–10 KPIs tied directly to what's most critical to the specific business — a discipline that separates firms with clear financial visibility from those drowning in noise.
Financial KPIs
| KPI | What It Measures |
|---|---|
| Gross Margin by Project | Actual profit vs. estimated at job level |
| Cost Performance Index (CPI) | Earned Value ÷ Actual Cost — below 1.0 signals overspend |
| WIP Over/Under-Billing | Whether revenue recognition aligns with cost incurred |
| Cash Flow Position | Current and projected liquidity |
| Change Order Recovery Rate | Percentage of change orders successfully billed and collected |
Operational KPIs
| KPI | What It Measures |
|---|---|
| Schedule Performance Index (SPI) | Earned Value ÷ Planned Value — below 1.0 signals schedule slippage |
| Labor Productivity | Hours per unit installed vs. estimate |
| Equipment Utilization Rate | Active use vs. available hours |
| Planned vs. Actual Completion | Schedule adherence by phase |
| Labor Downtime Percentage | Non-productive field hours as a share of total |
Safety and Quality KPIs
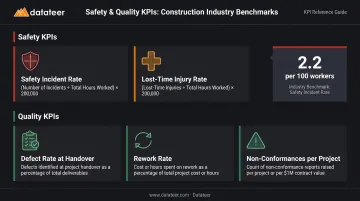
Safety and quality KPIs drive hidden cost control. According to the U.S. Bureau of Labor Statistics, the construction industry's 2024 total recordable cases incidence rate was 2.2 per 100 full-time workers. Poor performance generates direct costs through delays, liability, and rework. The Construction Industry Institute has benchmarked rework costs at 2–20% of a project's contract amount.
- Safety Incident Rate — (Incidents × 200,000) / Employee hours worked
- Lost-Time Injury Rate — incidents causing missed work days
- Defect Rate at Handover — percentage of items failing final inspection
- Rework Rate — percentage of completed work requiring redo
- Number of Non-Conformances — formal quality failures per project
Business-Level KPIs
These track strategic health across the full portfolio, not just individual jobs:
- Backlog Value and Burn Rate — forward revenue visibility over 6–18 months
- Overhead Cost Ratio — G&A as a percentage of revenue; flags bloat before it compounds
- Bid-Hit Ratio — win rate on proposals submitted
- Return on Revenue — net income as a percentage of top-line revenue
- Tracks repeat business and referral health: Client Satisfaction Score
What Happens When Construction KPIs Are Ignored
The pattern is predictable. Project financials get reviewed at month-end. WIP reports take two weeks to compile. By the time the numbers land on a CFO's desk, the project is three weeks further along — and so is the problem.
The consequences compound:
- Reactive firefighting replaces strategic decision-making. Leadership learns about cost overruns when they're no longer correctable, only recorded.
- Client relationships erode when schedule delays and budget surprises become recurring features of project delivery.
- Scaling becomes unreliable because there's no credible data showing which project types, contract structures, or client segments actually generate margin vs. consume it.
- Cash crises appear without warning when billing and collections KPIs go unmonitored, interrupting payroll, subcontractor payments, or new project starts.
The research puts numbers to this pattern. KPMG found 37% of construction firms missing budget or schedule targets by 20% or more. Levelset found that only 30% of contractors finish projects on time and within budget. Both figures point to the same root cause: by the time leadership sees the data, the window to act has already closed.
How to Get the Most Value from Your Construction KPIs
Three conditions determine whether a KPI program actually changes business outcomes:
- The data must be current — a WIP report built from two-week-old spreadsheet exports is not a management tool
- Review must be consistent — weekly for operational KPIs, at minimum monthly for business-level KPIs
- Insights must connect to documented decisions — not just observations
That first condition is where most firms fall apart. When building a WIP report requires 10–20 days of Excel work, the resulting metric is already outdated before it reaches the executive team. Double L Management described exactly this before automating: a single report required two weeks of manual effort. After connecting to Datateer, that same report became one click.
Datateer connects directly to 12+ construction ERPs — including Procore, Sage, Viewpoint Vista, and Acumatica — and delivers 12 pre-built dashboards across financial operations, field performance, executive strategy, and resource productivity on day one.
The platform refreshes overnight automatically. Instead of a month-end reporting grind, finance teams open current data every morning.
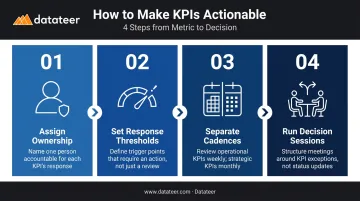
To make KPIs genuinely actionable:
- Assign each KPI to a named individual who owns the number and is accountable for explaining variances
- Set thresholds that automatically trigger a response (not just a note)
- Separate operational KPI cadence (weekly) from business-level KPI cadence (monthly)
- Treat KPI review meetings as decision sessions, not status updates
Finance teams that run this way can see margin fade forming at week three and intervene before it's locked in at project close. That's the difference between reporting on what happened and actually changing the outcome.
Conclusion
Construction KPIs are most valuable not as a reporting formality, but as an operational discipline. The firms that use them well treat KPI review as a core management practice — something that gives leadership genuine control over project outcomes rather than a retrospective account of what went wrong.
The advantages covered here — financial visibility, operational efficiency, and cash flow predictability — reinforce each other in practice. A company that catches margin fade early generates better cash flow. Better cash flow supports confident project starts. More profitable projects sharpen the institutional knowledge that makes future bids more accurate. That compounding effect is what distinguishes firms that scale deliberately from those that stay reactive.
The firms getting there fastest aren't the ones tracking more metrics. They're the ones tracking the right ones, consistently, with data current enough to act on.
Frequently Asked Questions
What is KPI in business intelligence?
In BI, KPIs are the specific metrics surfaced in dashboards that measure performance against strategic goals. Unlike raw data, KPIs are pre-selected for relevance and visualized to drive decisions — the distinction is intentionality, not just quantity.
What are the 4 pillars of KPI?
The four common pillars are: Measurable (can be numerically tracked), Relevant (tied to a business goal), Actionable (able to prompt a decision or change), and Time-bound (tracked against a defined period or target).
What are the most important KPIs for construction companies?
The most critical KPIs span financial (CPI, WIP, gross margin), operational (SPI, labor productivity), safety (incident rates), and quality (rework and defect rates). The "most important" ones for any specific firm are those tied directly to where its margin and risk exposure are greatest.
How many KPIs should a construction company track?
CFMA recommends 8–10 carefully chosen KPIs covering the four core categories. Tracking too many dilutes focus; tracking too few creates blind spots.
What is the difference between a metric and a KPI in construction?
A metric is any quantifiable measurement — total labor hours logged, for example. A KPI is a metric designated as critical to a business objective and tracked against a specific target or threshold.
What are leading vs. lagging KPIs in construction?
Lagging KPIs measure outcomes already recorded — final project margin, completed-project defect rate. Leading KPIs predict future performance and enable course correction — current SPI, labor hours consumed vs. estimate at 30% completion.